Содержание
Reports
Statistics system of Internet Control Server could be configured manually as well as displayed with several standard reports. All those reside in «Reports» module. Each report is a subsystem of graphs and numerical values which are bound by time frames. Upper right corner contains a time period. All reports are generated for the given time-frame - day, week, month or variably specified. The day is the dafault setting.
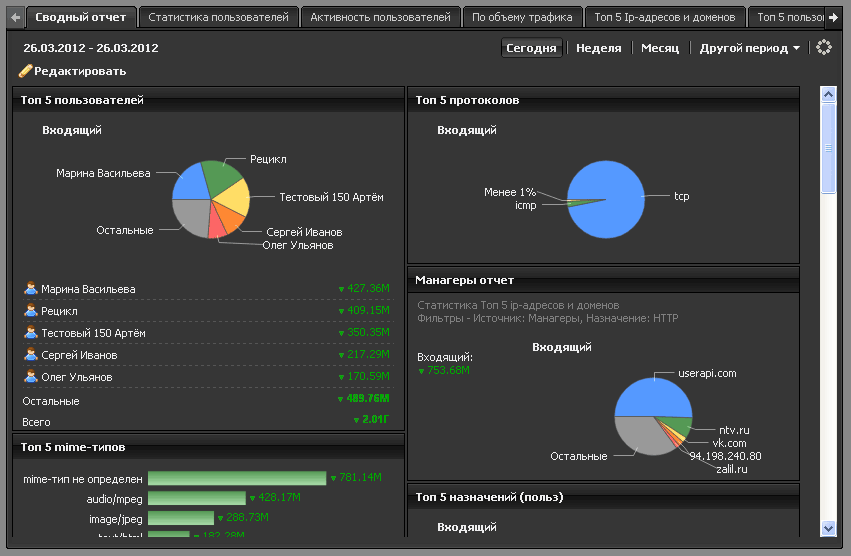
Consolidated report
Consolidated report allows displaying visually statistics about traffic consumption in the system. By default is consists from several reports: by user, by protocol, by visited sites etc… This page could be edited by changing the location of the reports, diagram view and its settings. You can also add your own reports. All reports are generated for the selected time-frame - day, week, month or arbitrarily specified.
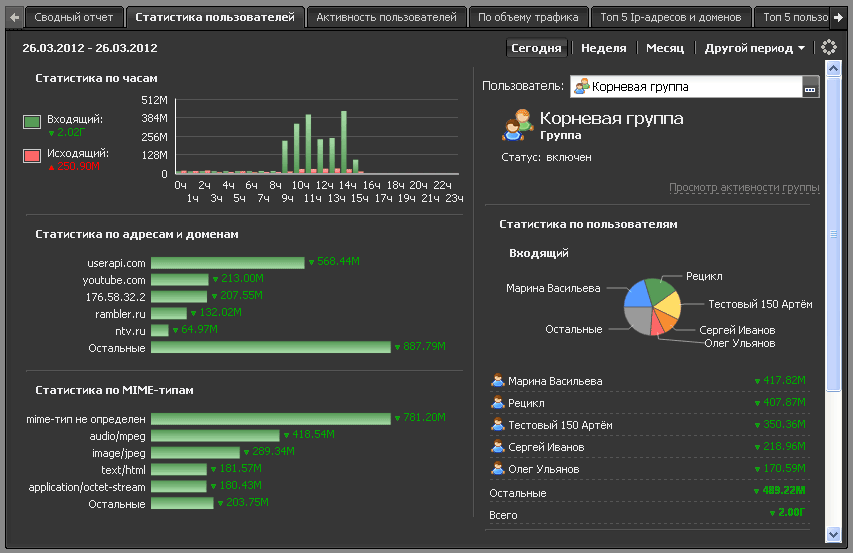
Users statistics
Contain the following for each user: by hour, address or domain (visited sites) statistics, MIME-types statistics, protocol statistics. In case is user's group is selected the report is substituted with the traffic volume report of all users in the group.
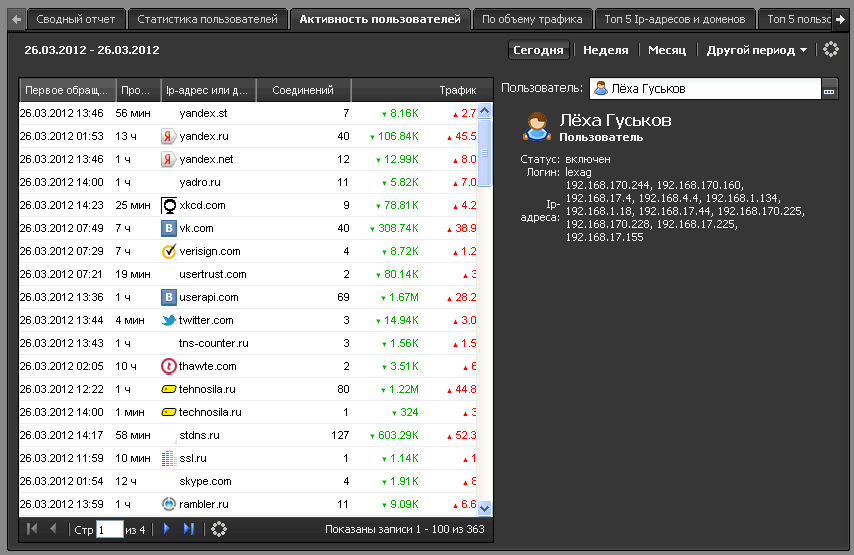
Users activity
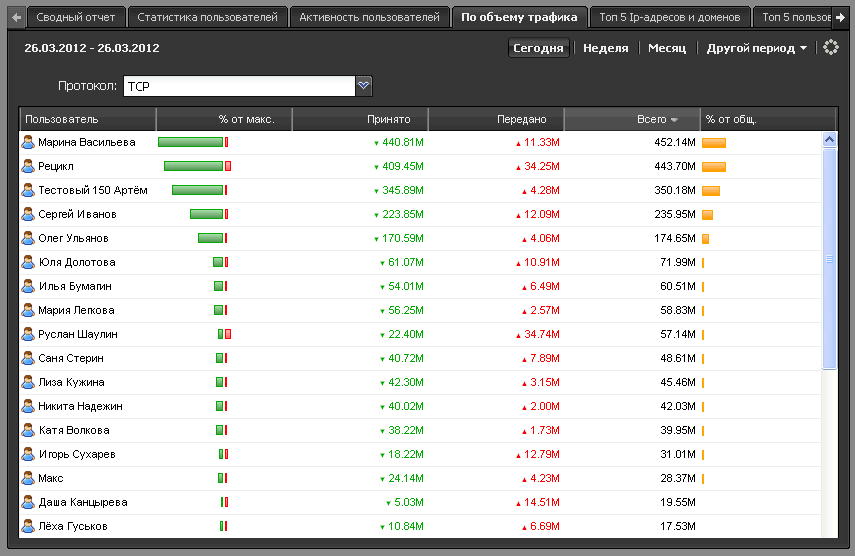
By traffic volume
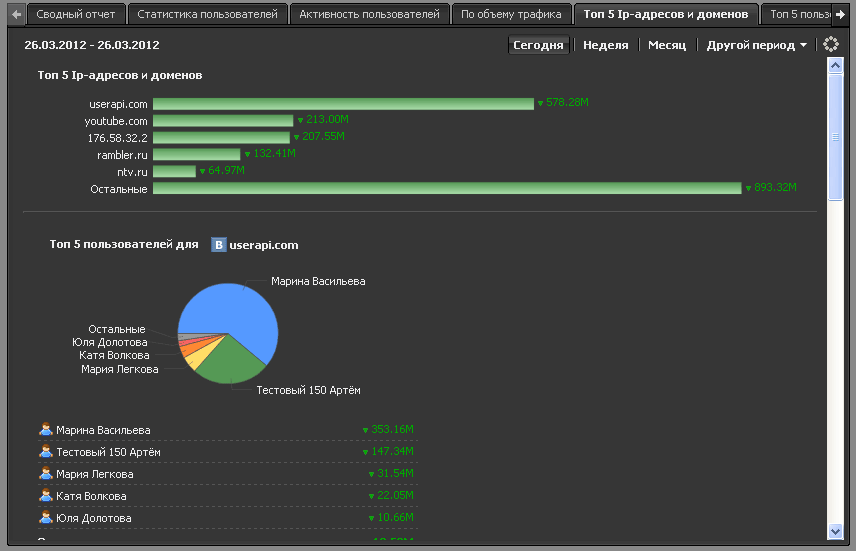
Top 5 ip-addresses and domains
Displays the list of 5 most visited hosts and domains as well as 5 most active users visiting those sites.
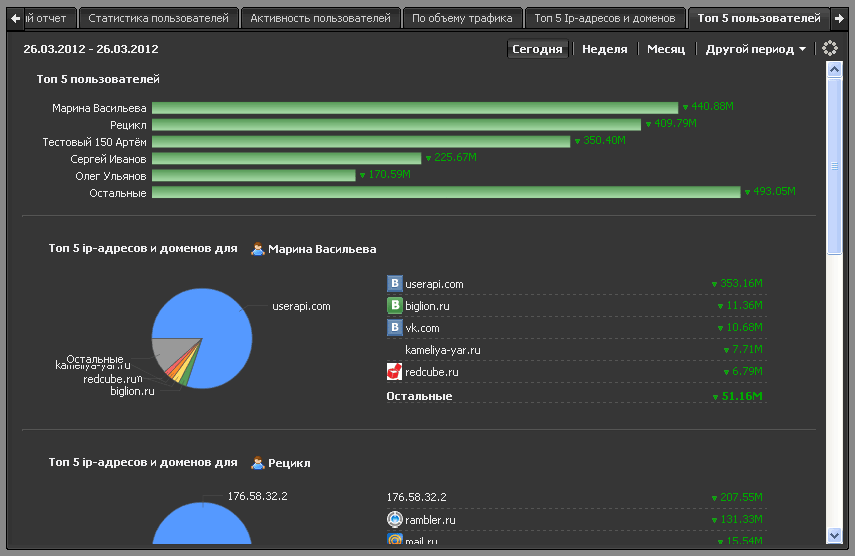
Top 5 users
Similar to previous report, but dysplays a list of most active users and list of top-5 visited domains for each.
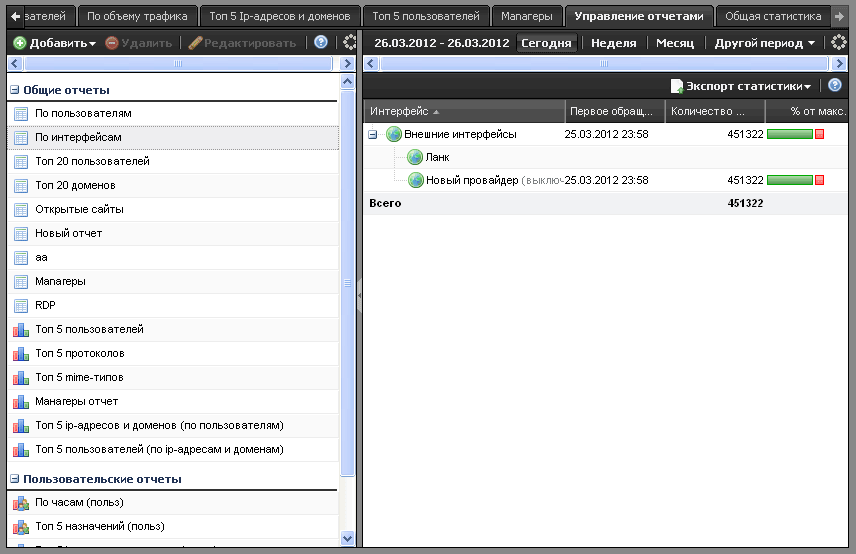
Reports management
Displays a list of all reports - standard and user-defined. You may create several typical reports which are mostly suitable for traffic-control of your organisation and review them at any time.
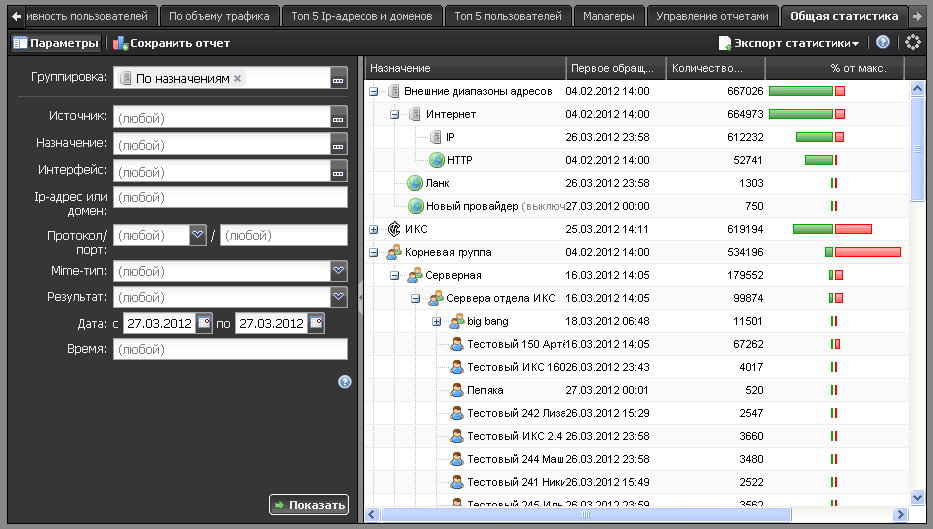
Report designer
This tab displays a report designed for the case when standard reports are not enough. The guide review the common principles of work with Report designer.

 Добавить страницу в книгу
  Удалить страницу из книги
  Показать или изменить шаблон книги (
 Помощь