Web-interface
Accessing web-interface
After the installation, to log into the web interface from any PC in your LAN you need to enter the IP address that you specified during the installation in your internet browser. Installation.
We recommend to use Mozilla Firefox or Google Chrome as a web browser.
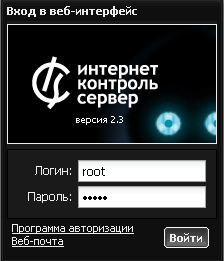
After that the web-interface loading process will start and login/password window appear.
During the first login to web interface you need to use login root and password 00000 (five zeros).
Main web-page
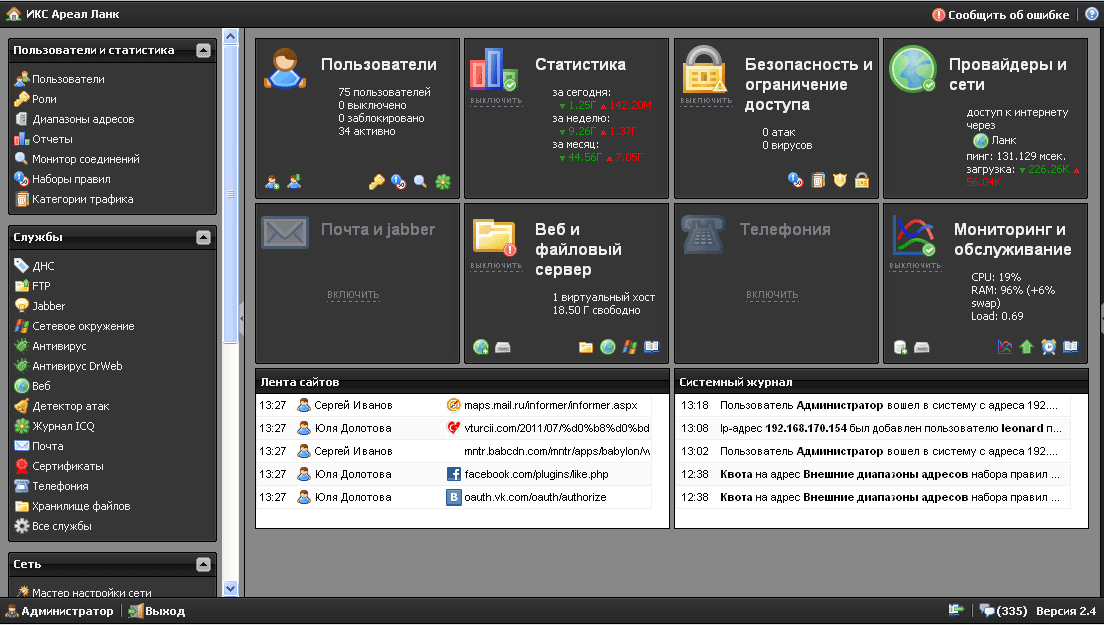
The interface is divided into 2 parts. Left part contains a list of system modules, right - a window of currently select module. During the first login none of the modules is highlighted, thus you see the main system page.
Warning! It is strongly recommended to change the administrator password immediately on first login. Otherwise third parties might get access to ICS management interface.
Widgets
Web-interface main page is the widgets system, allowing you to get actual information about the system in real-time.
| Widget | Information | Possible Actions | Links | Reated services |
| Users | Total quantity, Active Users, Blocked Users, Disabled users | Add user, Import user | Users, Roles, Connection Monitor, ICQ journal | - |
| Statistics | Amount of incoming and outgoing traffic for the current day, month, year | Enable Statistics / Disable Statistics | Reports | Statistics, Counters |
| Security and access limitation | Number of attacks and detected viruses | Enable security system / Disable security system | Proxy, Access-rules, Rules Categories, Firewall rules, Proxy (settings) | Http proxy-filter, Firewall , Attack detector, Antivirus, Antivirus Proxy-Server |
| ISPs and networks | Default ISP, Default Gateway ping, Average interface load, Number of VPN connections | Network Wizard | ISPs and networks, VPN (access-list), Statistics, Network tools | - |
| Mail and Jabber | Amount of processed mails (send, received, marked as SPAM, marked with virus | Enable Mail System, Disable mail system, Add Mailbox | Mail: main page, Domains & mailboxes, Filters, Address book, Mail queue, Statistics | Mail Server, Mail Storage, Mail Collector |
| Web and File Servers | Quantity of virtual hosts, Free disk space | Enable/Disable File Server, Add Virtual Host, Plug Hard Drive | File Storage, Web (resources), Network Neighborhood (identification), Web (log) | Web server, FTP Server, Network neighborhood |
| Telephony | Enable/Disable telephony | Add number, Add fax number | Telephony (numbers, rules, call-log) | Telephony |
| Monitoring and maintenance | CPU load, RAM utilization, Time left for demo-version (if system is not activated) | Enable/Disable system monitoring, Creation of backup, Add hard drive | Monitoring, Updates, Time and Date, System Log | System state monitoring, System notifications |
2 More widgets are located in the lower corner are displaying current user browsing activity and last system log events. All widgets are renewed in real-time.
Query journal
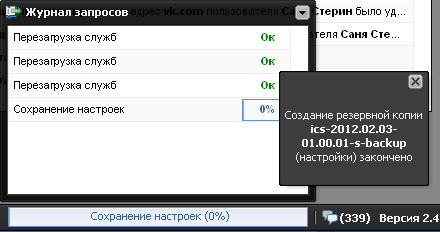
There are several informational elements located in the lower right corner of the interface.
Current action indicator shows which operation is performed by the system currently and its readiness in percent (%).
Query Journal opens a summary of last system operations.
Unread system messages icon displays amount of unread system messages since last system login. Once clicked it will display last unread message in the pop-up window.
System version displays current ICS version, once clicked it will display About.
It is necessary to perform Initial system configuration wizzard on the first login..

 Добавить страницу в книгу
  Удалить страницу из книги
  Показать или изменить шаблон книги (
 Помощь


